借用Matplotlib官网上的一张图片,可以很好的说明matplotlib的各个参数:
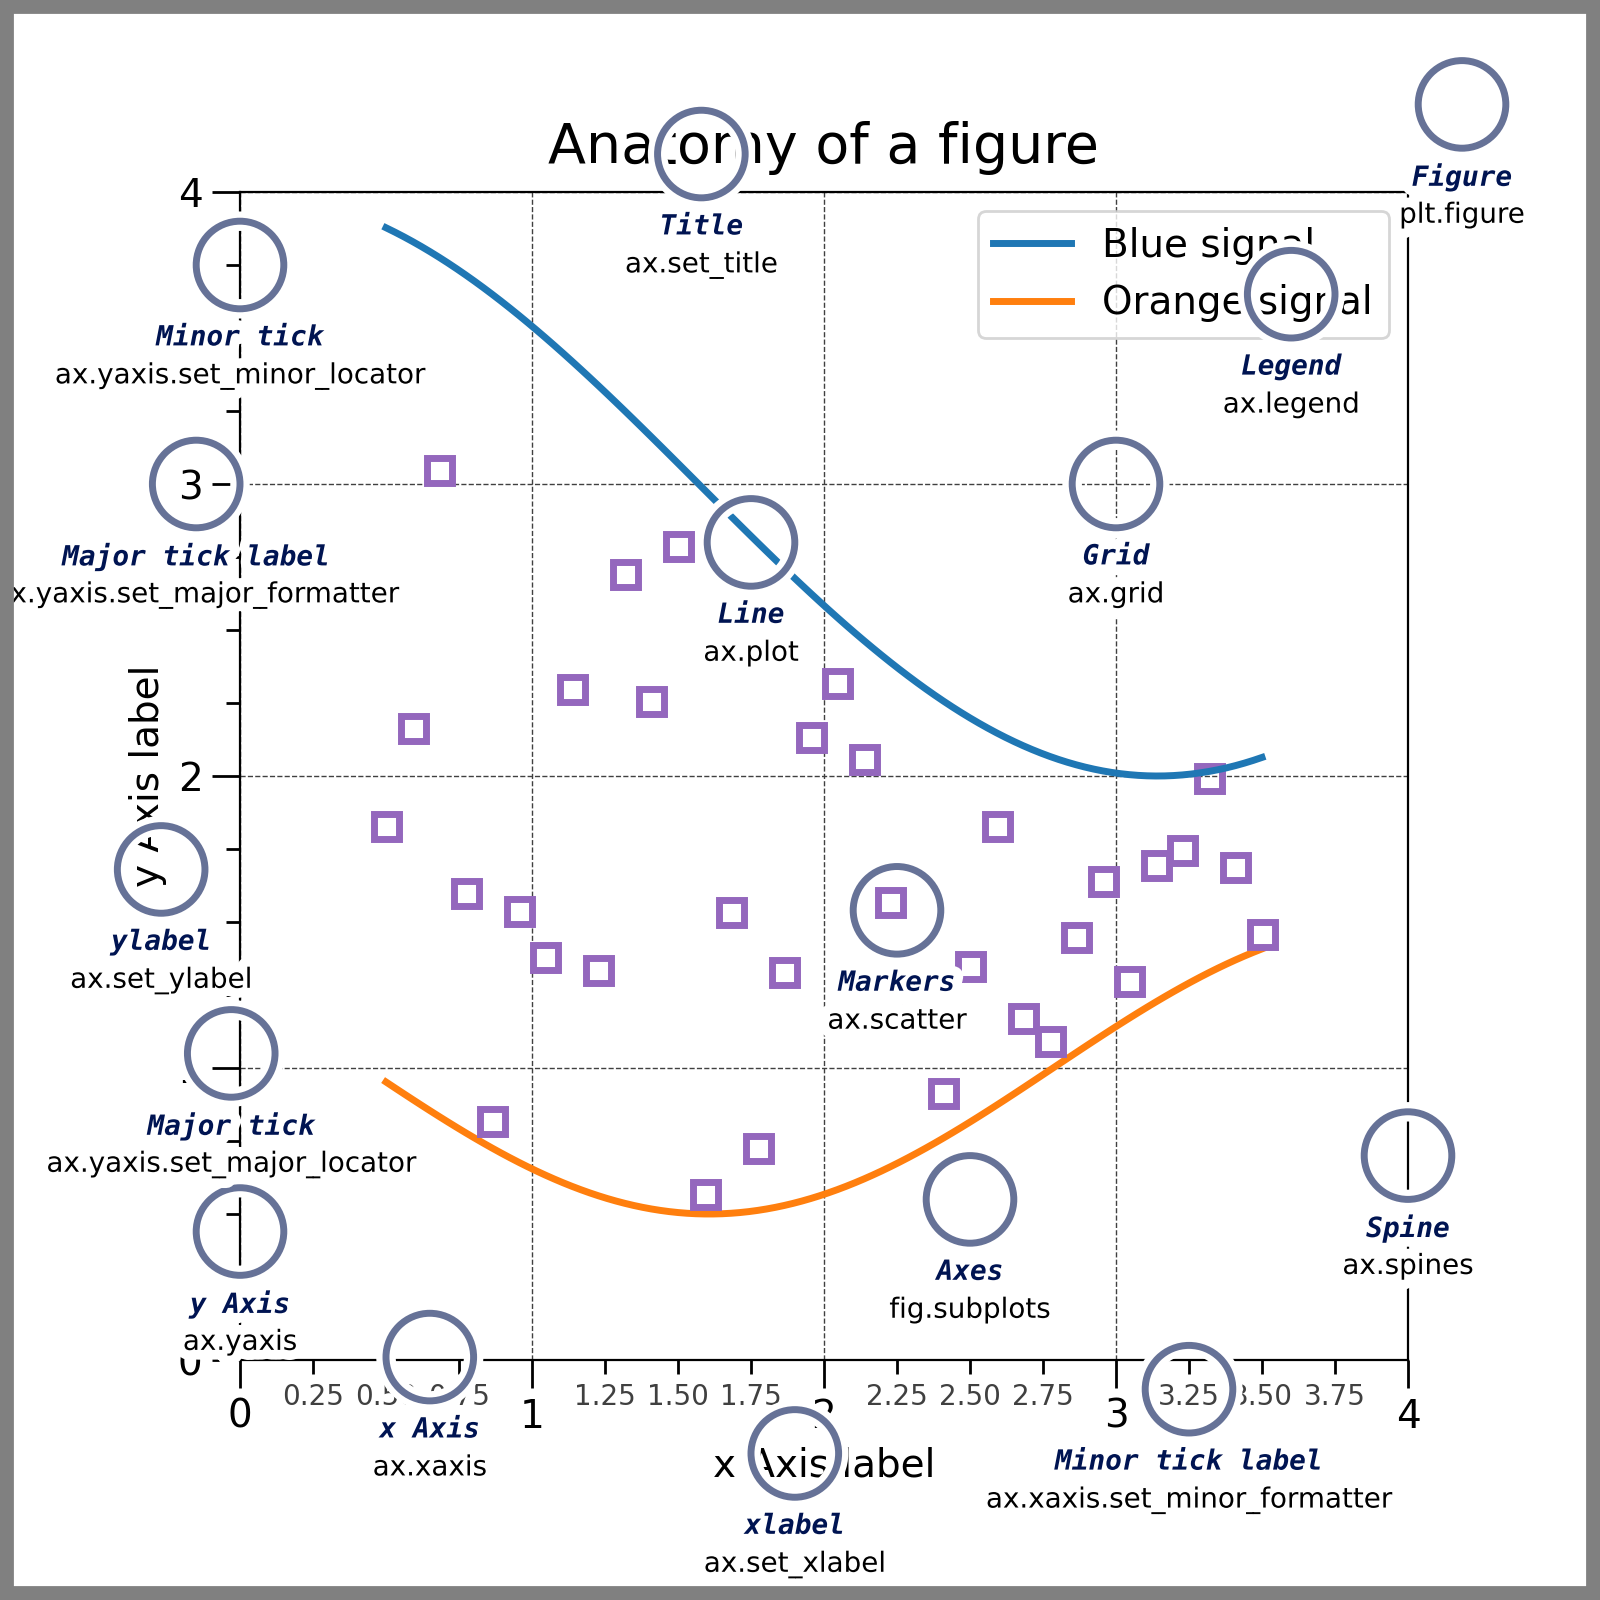
生成图片的源代码附在文章最后
在使用matplotlib绘图的时候,主要使用图示中所标注的元素:
Figure:图形绘制的画板,相当于一个黑板,所有的图都绘制在Figure上Axes:每个图都是一个Axes对象,一个Figure上可以有多个Axes对象Axis:x轴、y轴的对象Tick:x轴、y轴上的刻度对象,每个刻度都是一个Tick对象TickLabel:每个刻度上都要显示文字,这个文字显示在TickLabel上AxisLabel:x轴和y轴的名称Legend:图例对象Title:Axes图的标题对象Line2D:绘制在Axes上的线条对象,比如折线图Reactangle:绘制在Axes上的矩形对象,比如条形图Marker:标记点,比如绘制在散点图上的每个点Artist:只要绘制在Figure上的元素(包括Figure本身),都是Artist的子类
一、matplotlib的基本使用:
Figure容器是最顶层的容器,几乎包含了这个图的所有对象,通过add_subplot和add_axes方法可以添加Axes对象,进而调整图形的标题、标签等属性,具体的方法可以参照上一篇文章。
二、多图布局
自动调整布局
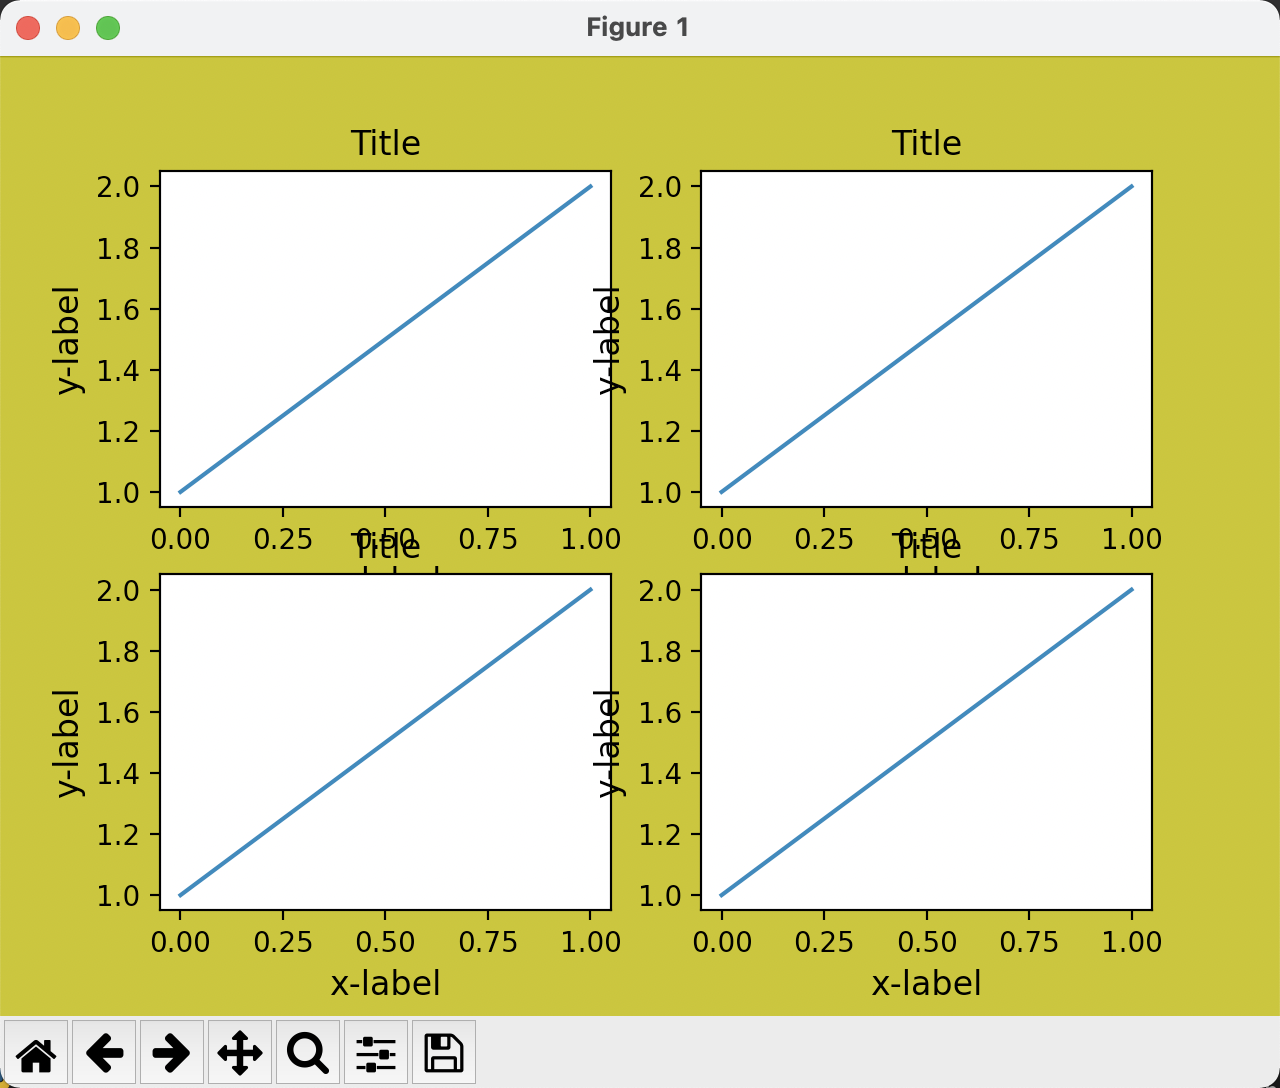
在一个Figure上可能存在多个Axes对象,如果Figure比较小,那么有可能会造成一些图形元素重叠,这时候我们可以通过fig.tight_layout或者fig.subplots_adjust方法进行调整,比如没有经过调整的代码及效果图如下:
1 | import matplotlib.pyplot as plt |
效果图如下:
为了避免多个图重叠,可以使用plt.tight_layout来实现:
1 | # 之前的代码... |
效果图如下:
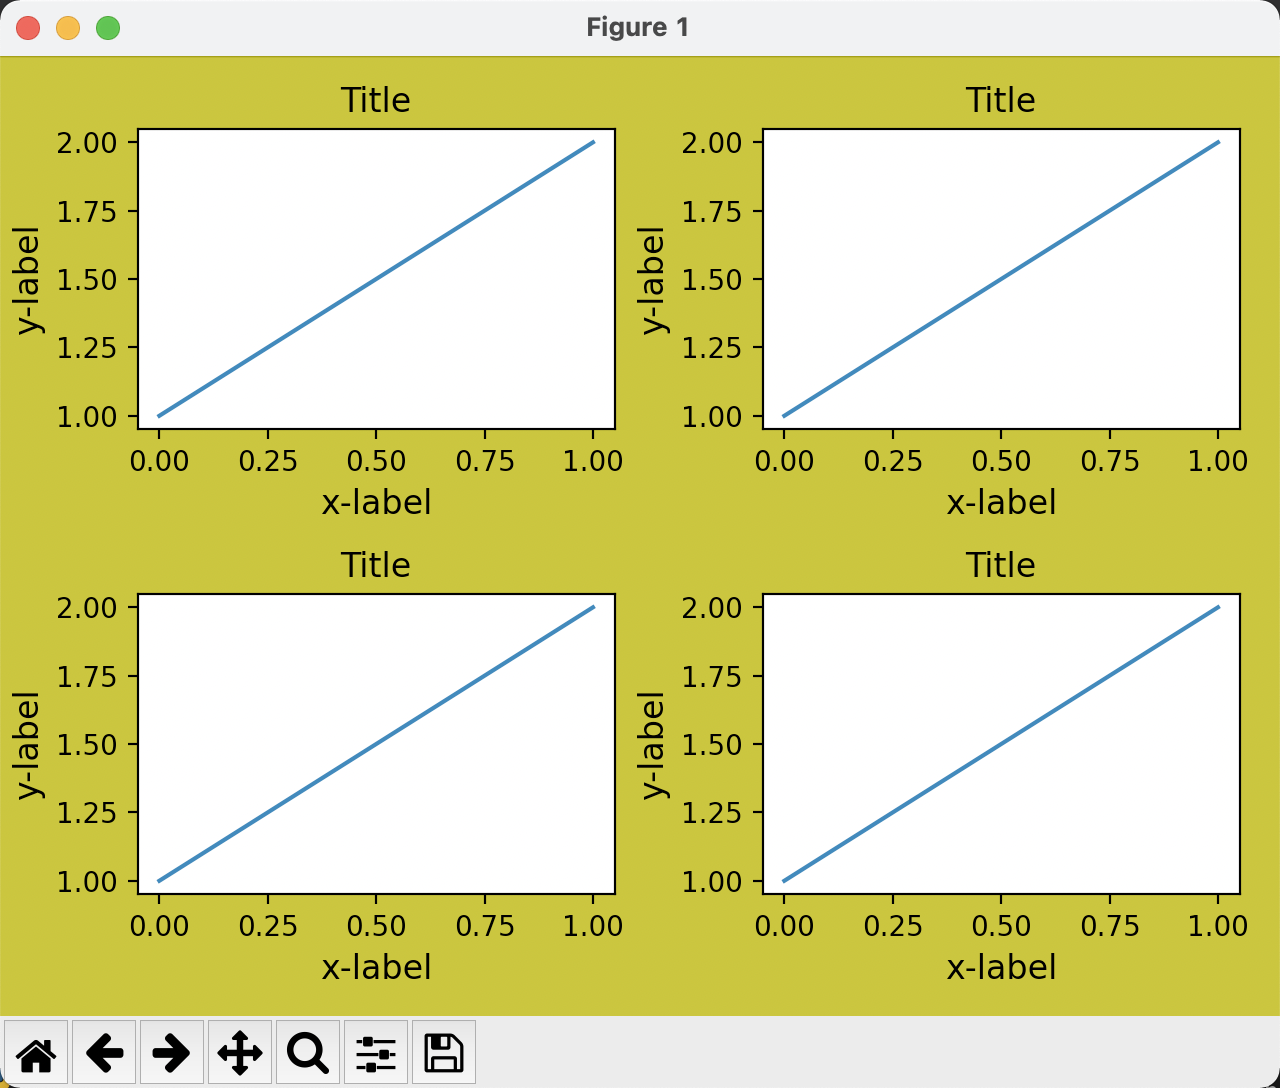
其中tight_layout还有两个参数可以使用,分别是w_pad和h_pad,这两个参数分别表示在水平方向和垂直方向的图间距。
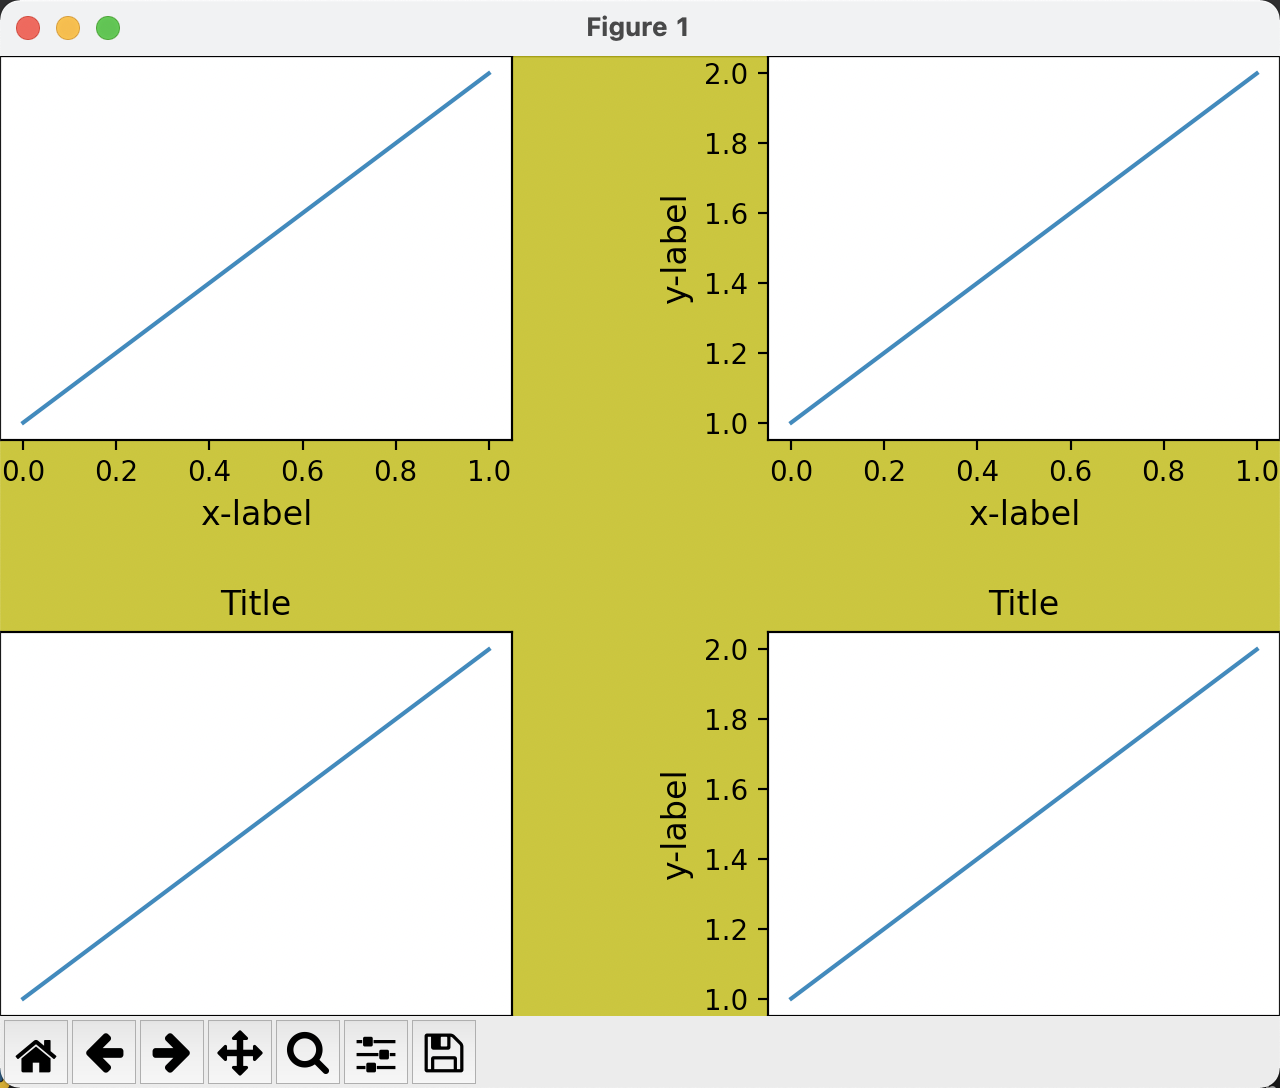
另外也可以通过fig.subplots_adjust方法实现:
1 | # 之前的代码... |
自定义布局
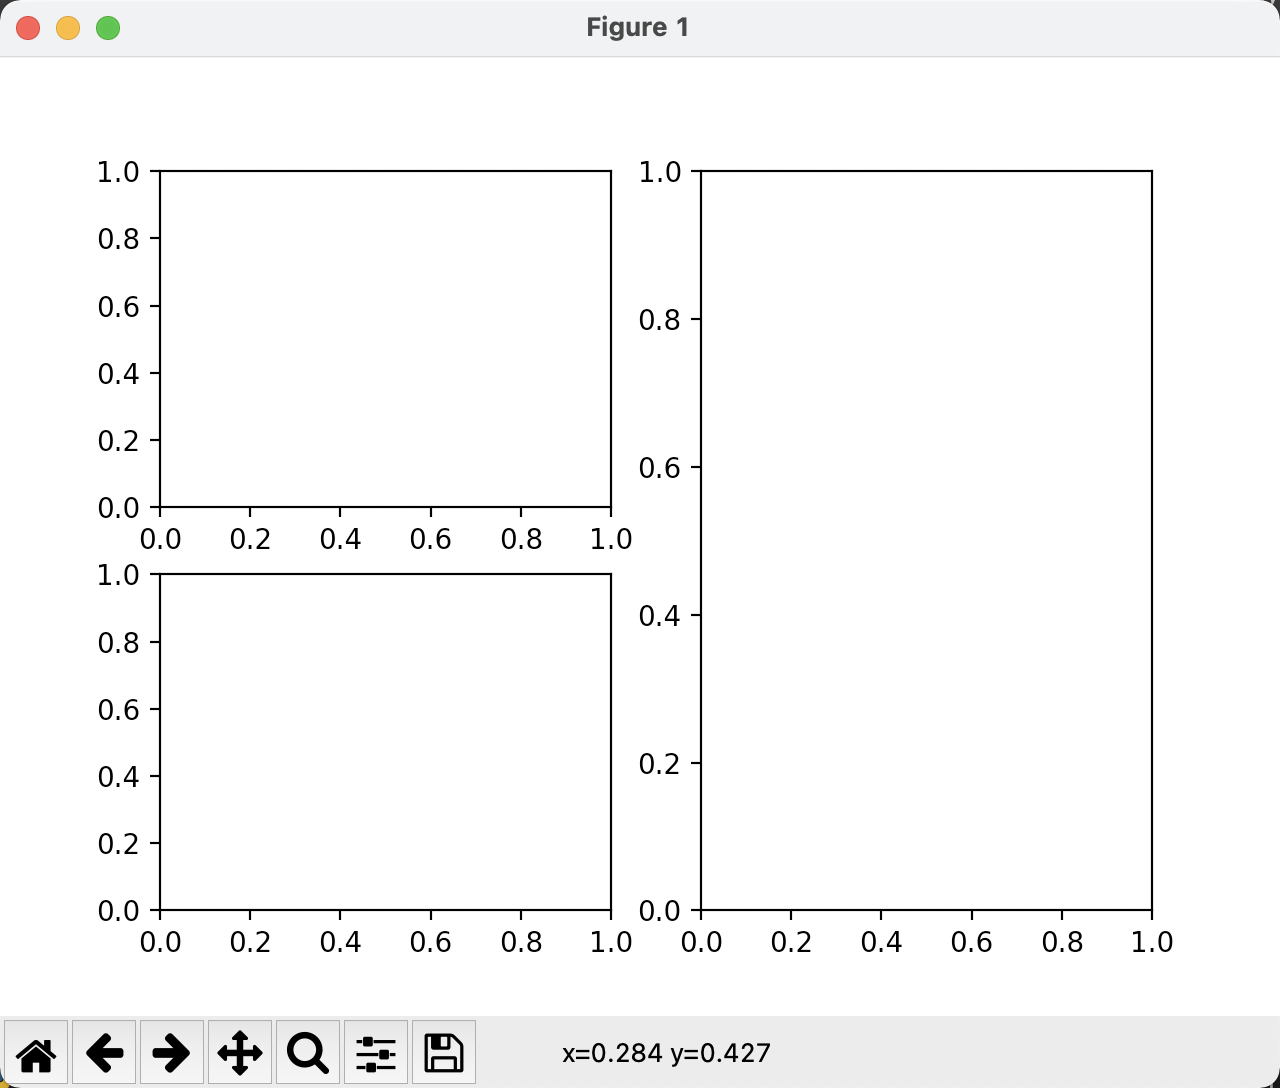
如果布局不是固定的几宫格方式,而是某个图占据了多行或者多列,那么就需要采取一些手段来实现,如果不是很复杂,可以通过subplot方法来实现,例如:
1 | import matplotlib.pyplot as plt |
效果图如下:
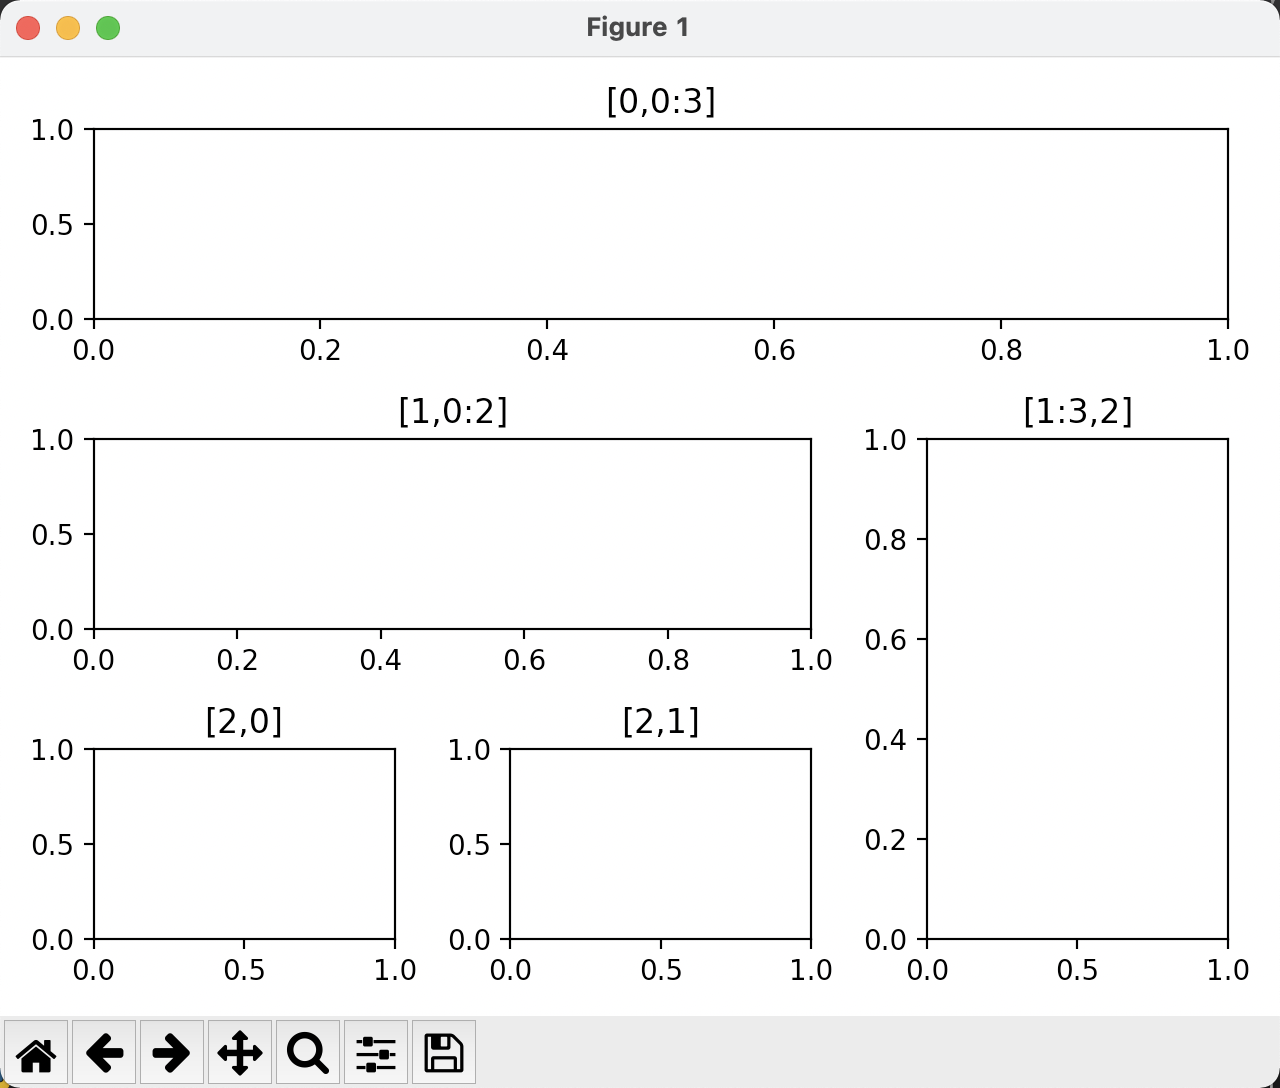
如果实现的布局比较复杂,可以使用GridSpec对象来实现,示例代码如下:
1 | import matplotlib.pyplot as plt |
效果图如下:
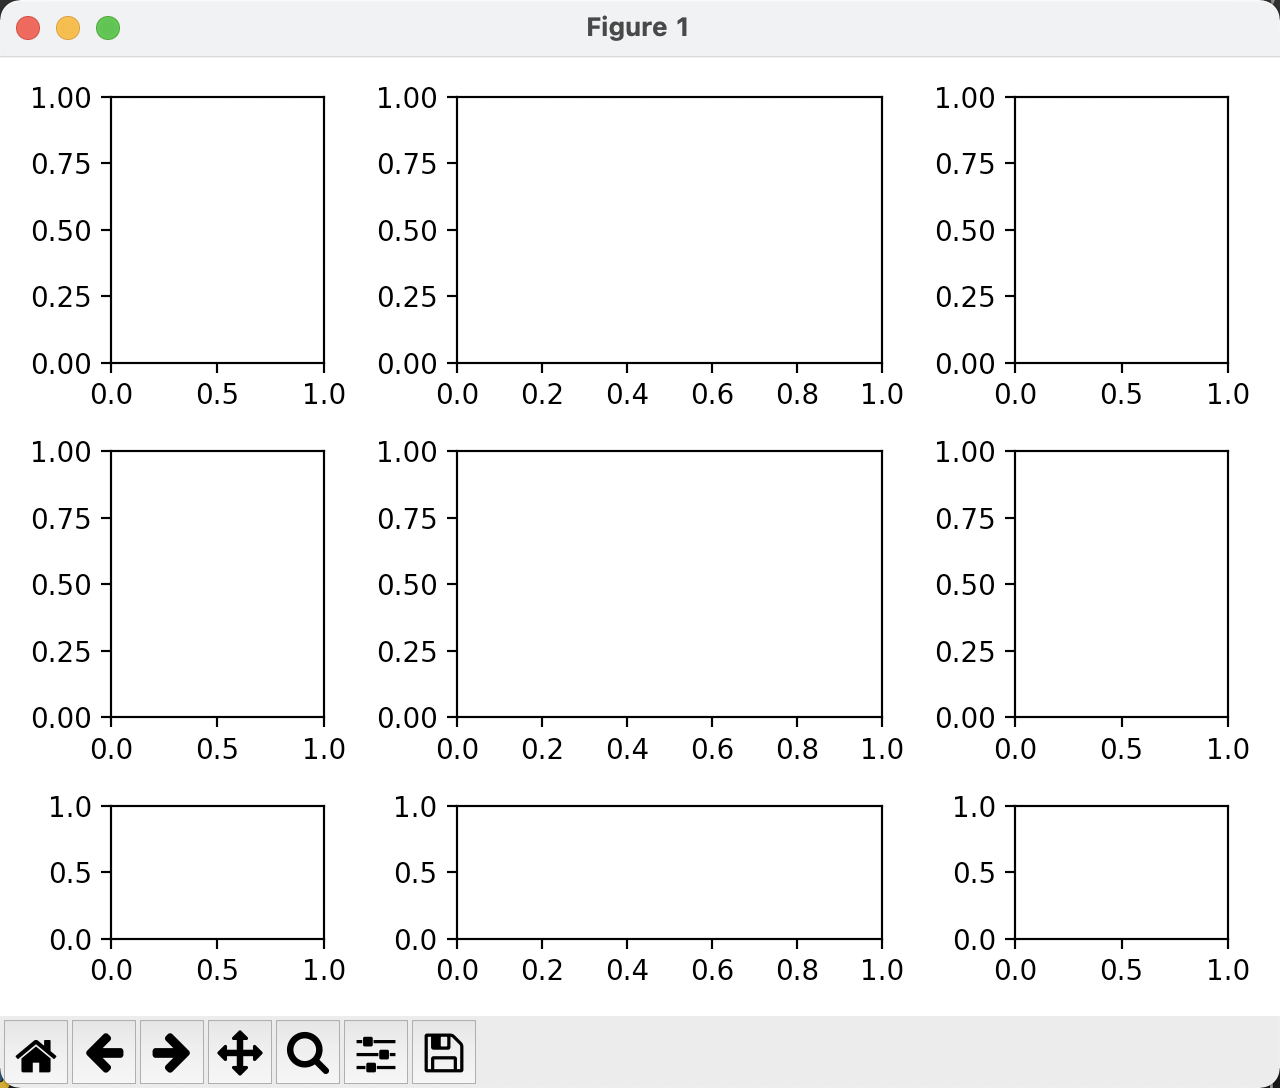
GridSpec对象默认的长宽比为1:1,也可以设置自定义宽高比例,示例代码如下:
1 | import matplotlib.pyplot as plt |
效果图如下:
手动设置位置
通过fig.add_axes的方法添加Axes对象,可以直接指定图片位置,也可以在添加完成后,通过axes.set_pisition的方法设置位置,示例代码如下:
1 | # add_axes的方式 |
matplotlib配置
常见默认的配置
修改默认的配置可以通过matplotlib.rcParams来设置,比如修改字体、线条大小等,示例代码如下:
1 | import matplotlib.pyplot as plt |
其中常用字体对应的名称如下:
| 字名称体名 | 描述 |
|---|---|
| 黑体 | SimHei |
| 仿宋 | FangSong |
| 楷体 | KaiTi |
| 宋体 | SimSun |
| 隶书 | LiSu |
| 幼圆 | YouYuan |
| 华文细黑 | STXihei |
| 华文楷体 | STKaiti |
| 华文宋体 | STSong |
| 华文中宋 | STZhongsong |
| 华文仿宋 | STFangsong |
| 华文舒体 | FZShuTi |
| 华文姚体 | FZYaoti |
| 华文彩云 | STCaiyun |
| 华文琥珀 | STHupo |
| 华文隶书 | STLiti |
| 华文行楷 | STXingkai |
| 华文新魏 | STXinwei |
Mac和Linux支持的字体可能会不同,如果不行,可以使用matplotlib.font_manager来指定具体字体。
其他默认配置
更多配置项请参考matplotlib官方网站
附上文章开头官方图片的绘制源码
2
3
4
5
6
7
8
9
10
11
12
13
14
15
16
17
18
19
20
21
22
23
24
25
26
27
28
29
30
31
32
33
34
35
36
37
38
39
40
41
42
43
44
45
46
47
48
49
50
51
52
53
54
55
56
57
58
59
60
61
62
63
64
65
66
67
68
69
70
71
72
73
74
75
76
77
78
79
80
81
82
83
84
85
86
87
88
89
90
91
92
93
94
95
96
97
98
99
100
101
102
103
104
105
106
107
108
109
110
111
112
113
114
115
116
117
118
119
120
121
122
123
124
125
126
127
128
129
130
131
132
133
134
135
136
137
138
139
140
141
142
import matplotlib.pyplot as plt
from matplotlib.patches import Circle, Rectangle
from matplotlib.patheffects import withStroke
from matplotlib.ticker import AutoMinorLocator, MultipleLocator
royal_blue = "#002082"
royal_blue = [0, 20/256, 82/256]
# make the figure
np.random.seed(19680801)
X = np.linspace(0.5, 3.5, 100)
Y1 = 3+np.cos(X)
Y2 = 1+np.cos(1+X/0.75)/2
Y3 = np.random.uniform(Y1, Y2, len(X))
fig = plt.figure(figsize=(8, 8), facecolor='1')
marg = 0.15
ax = fig.add_axes([marg, marg, 1-1.8*marg, 1-1.8*marg], aspect=1,
facecolor='1')
def minor_tick(x, pos):
if not x % 1.0:
return ""
return f"{x:.2f}"
ax.xaxis.set_major_locator(MultipleLocator(1.000))
ax.xaxis.set_minor_locator(AutoMinorLocator(4))
ax.yaxis.set_major_locator(MultipleLocator(1.000))
ax.yaxis.set_minor_locator(AutoMinorLocator(4))
# FuncFormatter is created and used automatically
ax.xaxis.set_minor_formatter(minor_tick)
ax.set_xlim(0, 4)
ax.set_ylim(0, 4)
ax.tick_params(which='major', width=1.0, labelsize=14)
ax.tick_params(which='major', length=10, labelsize=14)
ax.tick_params(which='minor', width=1.0, labelsize=10)
ax.tick_params(which='minor', length=5, labelsize=10, labelcolor='0.25')
ax.grid(linestyle="--", linewidth=0.5, color='.25', zorder=-10)
ax.plot(X, Y1, c='C0', lw=2.5, label="Blue signal", zorder=10)
ax.plot(X, Y2, c='C1', lw=2.5, label="Orange signal")
ax.plot(X[::3], Y3[::3], linewidth=0, markersize=9,
marker='s', markerfacecolor='none', markeredgecolor='C4',
markeredgewidth=2.5)
ax.set_title("Anatomy of a figure", fontsize=20, verticalalignment='bottom')
ax.set_xlabel("x Axis label", fontsize=14)
ax.set_ylabel("y Axis label", fontsize=14)
ax.legend(loc="upper right", fontsize=14)
# Annotate the figure
def just_circle(x, y, radius=0.15):
c = Circle((x, y), radius, clip_on=False, zorder=10, linewidth=2.5,
edgecolor=royal_blue + [0.6], facecolor='none',
path_effects=[withStroke(linewidth=7, foreground=(1, 1, 1, 1))])
ax.add_artist(c)
def text(x, y, text):
ax.text(x, y, text, zorder=100,
ha='center', va='top', weight='bold', color=royal_blue,
style='italic', fontfamily='monospace',
path_effects=[withStroke(linewidth=7, foreground=(1, 1, 1, 1))])
def code(x, y, text):
ax.text(x, y, text, zorder=100,
ha='center', va='top', weight='normal', color='0.0',
fontfamily='Courier New', fontsize='medium',
path_effects=[withStroke(linewidth=7, foreground=(1, 1, 1, 1))])
def circle(x, y, txt, cde, radius=0.15):
just_circle(x, y, radius=radius)
text(x, y-0.2, txt)
code(x, y-0.33, cde)
# Minor tick label
circle(3.25, -0.10, "Minor tick label",
"ax.xaxis.set_minor_formatter")
# Major tick
circle(-0.03, 1.05, "Major tick", "ax.yaxis.set_major_locator")
# Minor tick
y = 3.75
circle(0.00, 3.75, "Minor tick", "ax.yaxis.set_minor_locator")
# Major tick label
circle(-0.15, 3.00, "Major tick label", "ax.yaxis.set_major_formatter")
# X Label
circle(1.90, -0.32, "xlabel", "ax.set_xlabel")
# Y Label
circle(-0.27, 1.68, "ylabel", "ax.set_ylabel")
# Title
circle(1.58, 4.13, "Title", "ax.set_title")
# Blue plot
circle(1.75, 2.80, "Line", "ax.plot")
# Scatter plot
circle(2.25, 1.54, "Markers", "ax.scatter")
# Grid
circle(3.00, 3.00, "Grid", "ax.grid")
# Legend
circle(3.60, 3.65, "Legend", "ax.legend")
# Axes
circle(2.5, 0.55, "Axes", "fig.subplots")
# Figure
circle(4.185, 4.3, "Figure", "plt.figure")
# x Axis
circle(0.65, 0.01, "x Axis", "ax.xaxis")
# y Axis
circle(0, 0.44, "y Axis", "ax.yaxis")
# Spine
circle(4.0, 0.7, "Spine", "ax.spines")
# frame around figure...
fig.add_artist(Rectangle((0, 0), width=1, height=1, facecolor='none',
edgecolor='0.5', linewidth=10))
plt.show()
